In this tutorial, we’ll delve into the essential skill of calculating percentage growth in Excel. Whether you’re a beginner or looking to expand your Excel repertoire, understanding the formula for percentage growth in Excel is crucial. So, let’s get started!
Why Understanding the Formula for Percentage Growth in Excel Matters
Percentage growth in Excel is a fundamental concept used to measure the increase or decrease in a value relative to its initial or base value. The percentage growth is expressed as a percentage. It allows you to track changes in data over time, therefore making it a valuable tool for various applications. This includes financial analysis, business performance evaluation, and more. By calculating percentage growth, you can easily compare how a value has changed relative to its starting point. This skill is therefore invaluable for anyone looking to make data-driven decisions and gain insights from their data.
Now that you understand the importance of percentage growth, let’s dive into the step-by-step process of writing formulas for percentage growth in Excel.
Step 1: Prepare Your Data to Create the Formula for Percentage Growth in Excel
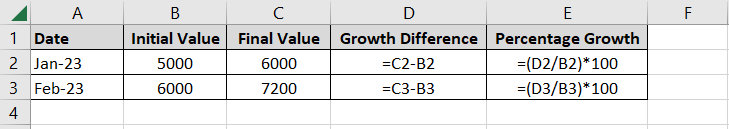
Before we calculate percentage growth, make sure your data is well-organised. Create a table with at least two columns. One column for the initial value (the base) and another for the final value.
Step 2: Calculate the Growth Difference
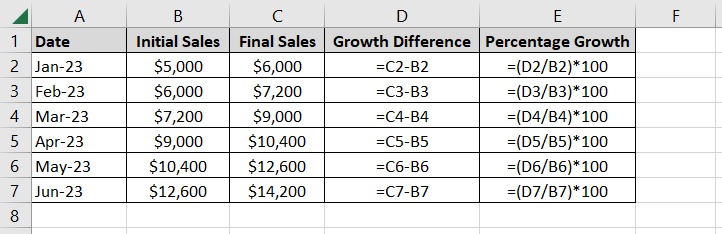
In the third column, subtract the final value from the initial value to calculate the growth difference. For example:

Step 3: Calculate Percentage Growth
Now, it’s time to find the percentage growth. In a new column, use the following formula:
= (Growth Difference / Initial Value) * 100
For example:
This formula calculates the percentage growth from the initial value to the final value.
Step 4: Format the Percentage Growth
To make your data more readable, you can format the percentage growth cells as percentages. To do this, select the cells containing the percentage growth, right-click, and choose “Format Cells.” Then, select “Percentage” and set the desired number of decimal places.
Examples of Formula for Percentage Growth in Excel
Let’s illustrate this with a practical example. Suppose you are tracking the sales growth of your business for six months. Your data might look like this:
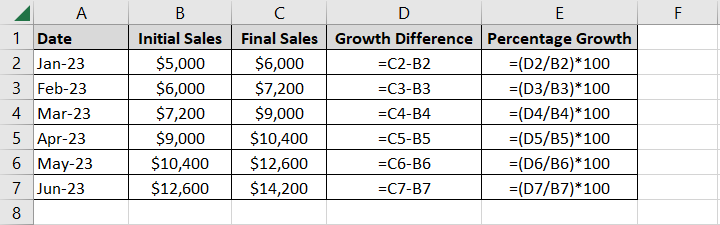
By using the formula for percentage growth, you can therefore easily track and analyse your business’s performance over time.
Unlocking the Power of Excel: Mastering the Formula for Percentage Growth in Excel
By mastering the formula for percentage growth in Excel, you can harness the full potential of this powerful tool for data analysis and decision-making. Remember to prepare your data, calculate the growth difference, and use the formula =(Growth Difference / Initial Value) * 100 to find the percentage growth. Properly formatted data will help you gain insights and make informed decisions.
Excel’s versatility is unmatched, and understanding key formulas like this one is a stepping stone to becoming an Excel expert.
To conclude, I hope you enjoyed this tutorial on how to create a formula for percentage growth in Excel. If you have any questions or comments, then please leave a message in the comments section below.
Unlock Efficiency with Our Excel Mug Collection!
Ready to add a dash of data-driven style to your daily routine? If so, explore our exceptional Excel Mug collection, designed to inspire Excel enthusiasts like you. These mugs are more than just coffee cups; they’re your daily dose of spreadsheet motivation. So don’t miss out – click below to shop now and elevate your Excel experience one sip at a time!
Etsy Shop: API reponse should be HTTP 200
API Error Description: Shared secret is required in x-api-key header.
Master Excel Formulas and Functions for Unmatched Data Analysis Productivity!
Do you want to learn how to write even more Excel formulas? If so, Excel Formulas and Functions Simplified is your ticket to Excel mastery. This Excel formulas book offers you the essential knowledge and practical skills to transform your spreadsheet experience from a novice to an expert.
This Excel formulas and functions book covers 88 of the best Excel formulas and functions. You will learn how to use functions including XLOOKUP, VLOOKUP, INDEX-MATCH, IF, CONCAT, TEXTJOIN, SUBSTITUTE, DATEDIF, TIMEVALUE, SUMPRODUCT, AVERAGEIFS, CELL, FREQUENCY, MINIFS, LARGE, ABS and more!
Don’t let Excel hold you back any longer. Empower yourself with the knowledge and skills you need to excel in Excel. For more information or to grab your copy now, click either of the buttons below. You will wonder how you ever managed without it!
If you prefer eBooks, then you can purchase this Excel book or many of the other Excel books I have written in eBook format. You can instantly download these books from my shop.
